Source Flow Plotter
Almost all programming today is exclusively understood through text-based systems. Programmers manipulate symbols to create meaning, and they examine symbols to make sense of it. They do not paint a picture or shape a physical object; they do not study a map or feel for texture. Humans think better when we think multimodally. We should not lock ourselves into a symbolic mode, but currently this is exactly what programmers do.
Source Flow Plotter is an experiment in understanding code visually and spatially. I built a first version in late 2014, and that's available on GitHub and viewable online. None of the work is optimized for being demo'd right now, so it's not self-explanatory, but see the write-up below for an explanation from early in the project's life.
Recently I resumed the project in connection with Alex Warth at Viewpoints Research Institute (VPRI) in LA.
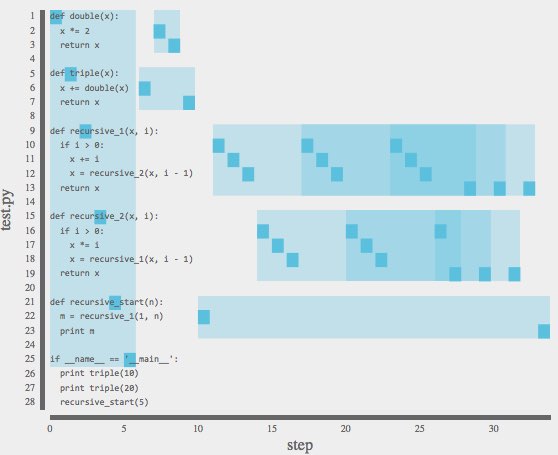
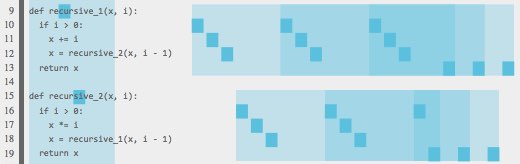
trace of two mutually-recursive functions. Functions' structures are highlighted.
Concept Sketch
Overview: Source Flow Plotter (SFP) illuminates the structure and meaning of a software program through visualizations of its control flow. For a given run of the program, SFP records each executed command and organizes these by the source code lines they represent. SFP then displays the path the program took through its lines of code, the time the program spent on each command, or the number of times each line was executed. It embellishes this with per-step information about program state. This builds an experienced developer's intuition about her code or helps her understand her colleague's code. She can refine the display to ask specific questions, such as "What subcall in this function takes the most time?", or "How often is this conditional branch executed, and what leads to its state?" For beginning programmers, SFP is a helpful tool for learning control flow patterns like conditional execution and loops.
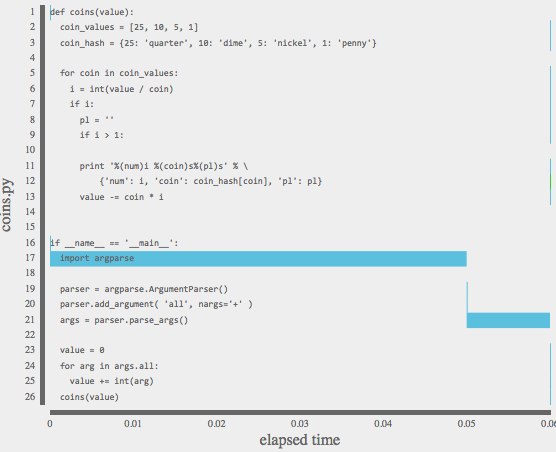
Display Modes: SFP can emphasize the order in which a program executes (step mode), the time each command takes (time mode), or the number of times each line of code is executed (histogram mode). Transitions between modes animate to encourage discovery of cross-mode relationships.
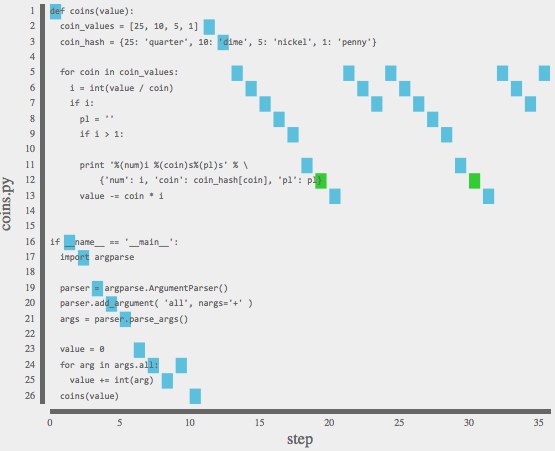
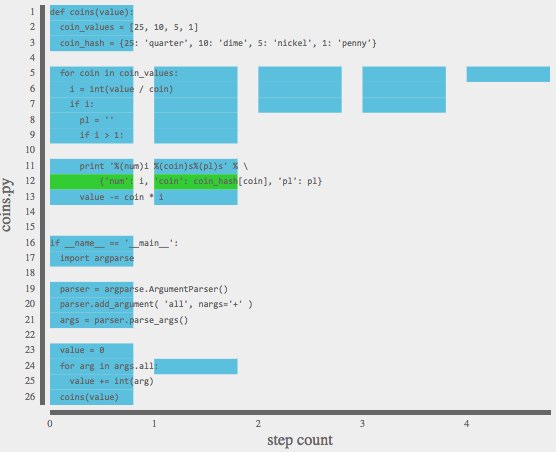
Colored Flow Points: SFP can color flow points to surface patterns. In the `coins.py` example above, flow points with side effects (print statements) are colored green. Other times, colorings emphasize conditional execution, flow points' calling functions, events triggered, or program state. Along with preset coloring options, flow points colors can be set with manual selection or with SFP tags placed directly into the source code.
Refining the Display: The set of displayed flow points can be refined to focus on the questions of interest. There are selection refinements and granularity refinements. Selections change the set of flow points displayed, and can be specified through direct selection of plotted flow points, through text or code (via a search bar), or through toggling displayed branches of a control flow tree. Granularity refinements change whether flow points are displayed individually or collected into clusters, such as clustering all points in a function definition. When the selected set of flow points is too large to display individually, SFP automatically clusters points until the display is meaningful, but clusters can be adjusted just like selections.
Showing State: SFP displays the state associated with a given flow point. It can show how this state changes across a selection of flow points and, when state can be plotted against time, SFP can display this plot aligned with the primary display. Collecting this state information can be expensive, but once collected, SFP integrates it.
Comparing Different Code Executions: SFP can also display smart comparisons of different code executions. For different runs of the same code (e.g. for different inputs or user interactions), SFP can detect cross-run control flow patterns and use these to align the compared plots. This is SFP's equivalent of a code diff. Along with comparing different executions of the same program, this technique can helpfully compare different programs that achieve the same purpose.
Representing Intrinsic Structure Across Time: Most software tools today are designed with questions in mind, and they are limited to giving narrow answers to predetermined questions. Those that are more general, like debuggers, usually do a poor job representing information across time. SFP represents control flow structure across time, and as a structural representation it is information rich: it naturally contains and communicates answers to many questions without those questions explicitly being asked. This emphasizes the relationships in the information, not just isolated facts, and it develops programmers' intuitions about software.
Use Cases: learn how control flow works, learn a new codebase, document a codebase, understand the control flow of complicated code, diagnose entangled control flows, discover and diagnose bugs, discover opportunities to improve code efficiency, learn how program execution changes with different input, compare different programs that achieve the same effect, explore an algorithm's behavior, develop intuition for a program.
Limitations: SFP requires code to be run in order to analyze it, and SFP is therefore constrained to examining instances of control flow for any program that changes with input or randomness. To gather flow point data, SFP needs language-specific auditing functions. It is therefore only applicable to the set of languages for which auditors have been written, is only as accurate as its audit, and only contains the data extracted by its audit. Line-by-line audits of execution time are often highly inaccurate. SFP's audits can also take a long time for large codebases, especially if state information is gathered. Lastly, current SFP designs assume code is sequential. Little thought has been given to SFP's extension to parallel code.
Current State of SFP: The version of SFP described above is here - note that this is different from the most recent version. At present, SFP is available for demo purposes only: it uses the `coins.py` pre-calculated dataset (or a `test.py` dataset for the newer version) and provides no user interface for using a different dataset. SFP is currently nowhere near the descriptions in this concept sketch, though most people who've seen it as is have already expressed desire to use it with their own code.
On Pause: The core work on SFP has been on pause while I've worked on related but separate explorations. I will continue to do so through the end of 2015, but starting 2016 I will be resuming work on SFP. Hopefully I'll also have fun things to share about what I've been doing instead.